Insights & Risk Monitoring
-
- Identity Provider (IdP): The Foundation of Sastrify Insights
- Uncover SaaS Usage and Shadow IT with Identity Provider (IdP) Discovery
- Integrating HRIS to Enrich Identities & Insights
- Admin Guide: Deploying the Sastrify Chrome Extension
- Admin Guide: Deploying the Sastrify Microsoft Edge Extension
- Manual Installation Guide: Sastrify Chrome Browser Extension
- Manual Installation Guide: Sastrify Edge Browser Extension
- Setting renewal dates & reminders
- Assigning & Modifying Subscription Owners
- Uploading & Managing Your SaaS Documents in Sastrify
- Sastrify App Support: Get Help & Give Feedback
- Sastrify's commitment to security and privacy standards
-
- Capturing Subscription Details with Contract AI
- Adding a New Subscription Manually
- Slack Integration: Bringing Sastrify into Your Internal Communication
- How to bulk upload your invoices
- Automating Document Uploads via Email Forwarding
- Managing Your Notification Preferences
- Tools and Spend Importer: Bulk Upload & Visualization
- Tool Matching: Aligning ERP Data with Your Inventory
- Managing Collaboration with Custom Tasks
- Task Automation: Standardizing and Automating Routine Actions
-
- Workflows: Automate procurement processes with consistency
- Requests: Streamline procurement process and internal approval
- Get Procurement Support for New Purchases and Renewals
- How to submit and track Procurement Requests via Jira Integration
- Scope of service: Custom benchmarking & contract review
- Scope of service: Negotiation & renewal support
- Scope of service: Custom SaaS Optimization Advisory
- Purchase your SaaS through the SastriMarket
-
- Connecting Your ERP & Accounting Software
- Spend Import: Validate and fine-tune your imported spend data
- Export spend data from Candis to Sastrify
- Export spend data from Spendesk to Sastrify
- Export spend data from Pleo to Sastrify
- Export spend data from Moss to Sastrify
- Export spend data from DATEV to Sastrify
- Export spend data from Ramp to Sastrify
-
- Configuring Authentication & Access
- User Management: Managing Users and Platform Roles
- Configuring Microsoft SSO Authentication
- Configuring Okta SSO Authentication
- Configuring JumpCloud SSO Authentication
- Configuring Cisco Duo SSO Authentication
- Configuring Cloudflare SSO Authentication
- Configuring OneLogin SSO Authentication
- Having trouble logging in?
- Understanding user roles and permissions
-
- Okta Identity Provider (IdP) Integration Guide
- Accounting & ERP: Connecting NetSuite to Sastrify
- Accounting & ERP: How to connect Quickbooks
- Accounting & ERP: How to connect Microsoft Dynamics 365
- Accounting & ERP: How to connect Workday ERP
- Accounting & ERP: How to integrate Pleo with Sastrify
- HRIS: Connecting Officient to Sastrify
-
- ERP & Accounting Integration FAQs
- SSO / IDP Discovery Integration FAQs
- Browser Extension FAQs
- HRIS Integration FAQs
- Usage Analytics FAQs
- Contract AI & Subscription Details FAQs
- Tools and Spend Importer FAQs
- Invoices FAQs
- Achieved Savings FAQs
- Form component guide for Sastrify form builder
- What is SaaS and Sastrify's scope of work?
- Who receives the renewal alerts or reminders?
- How does Sastrify work with currencies?
- Is the spend data from accounting export always up-to-date?
- How to work with benchmark prices
- When and how to involve Sastrify in a contract evaluation or negotiation?
- How does Sastrify interact with SaaS vendors?
- How do you handle confidentiality clauses in vendor contracts?
- Why is contract data essential for benchmarking and negotiation support?
Insights: Full Visibility into Identities & Usage across Your Organization Print
Modified on: Tue, 24 Feb, 2026 at 2:34 PM
The Insights page serves as Sastrify’s central hub for exploring product and identity activity. By visualizing the relationship between your products and your people as represented by identities, you can identify optimization opportunities, uncover underutilized subscriptions, and make data-driven decisions during your next renewal negotiation.
Understanding IDP Dependency & the Data Sources
To unlock any functionality within the Insights page, an active Identity Provider (IdP) connection is mandatory. The IDP acts as the "Single Source of Truth" and the anchor for all identity-related data. Without a connected IdP, Insights Page will remain inactive as there is no foundational data to display.
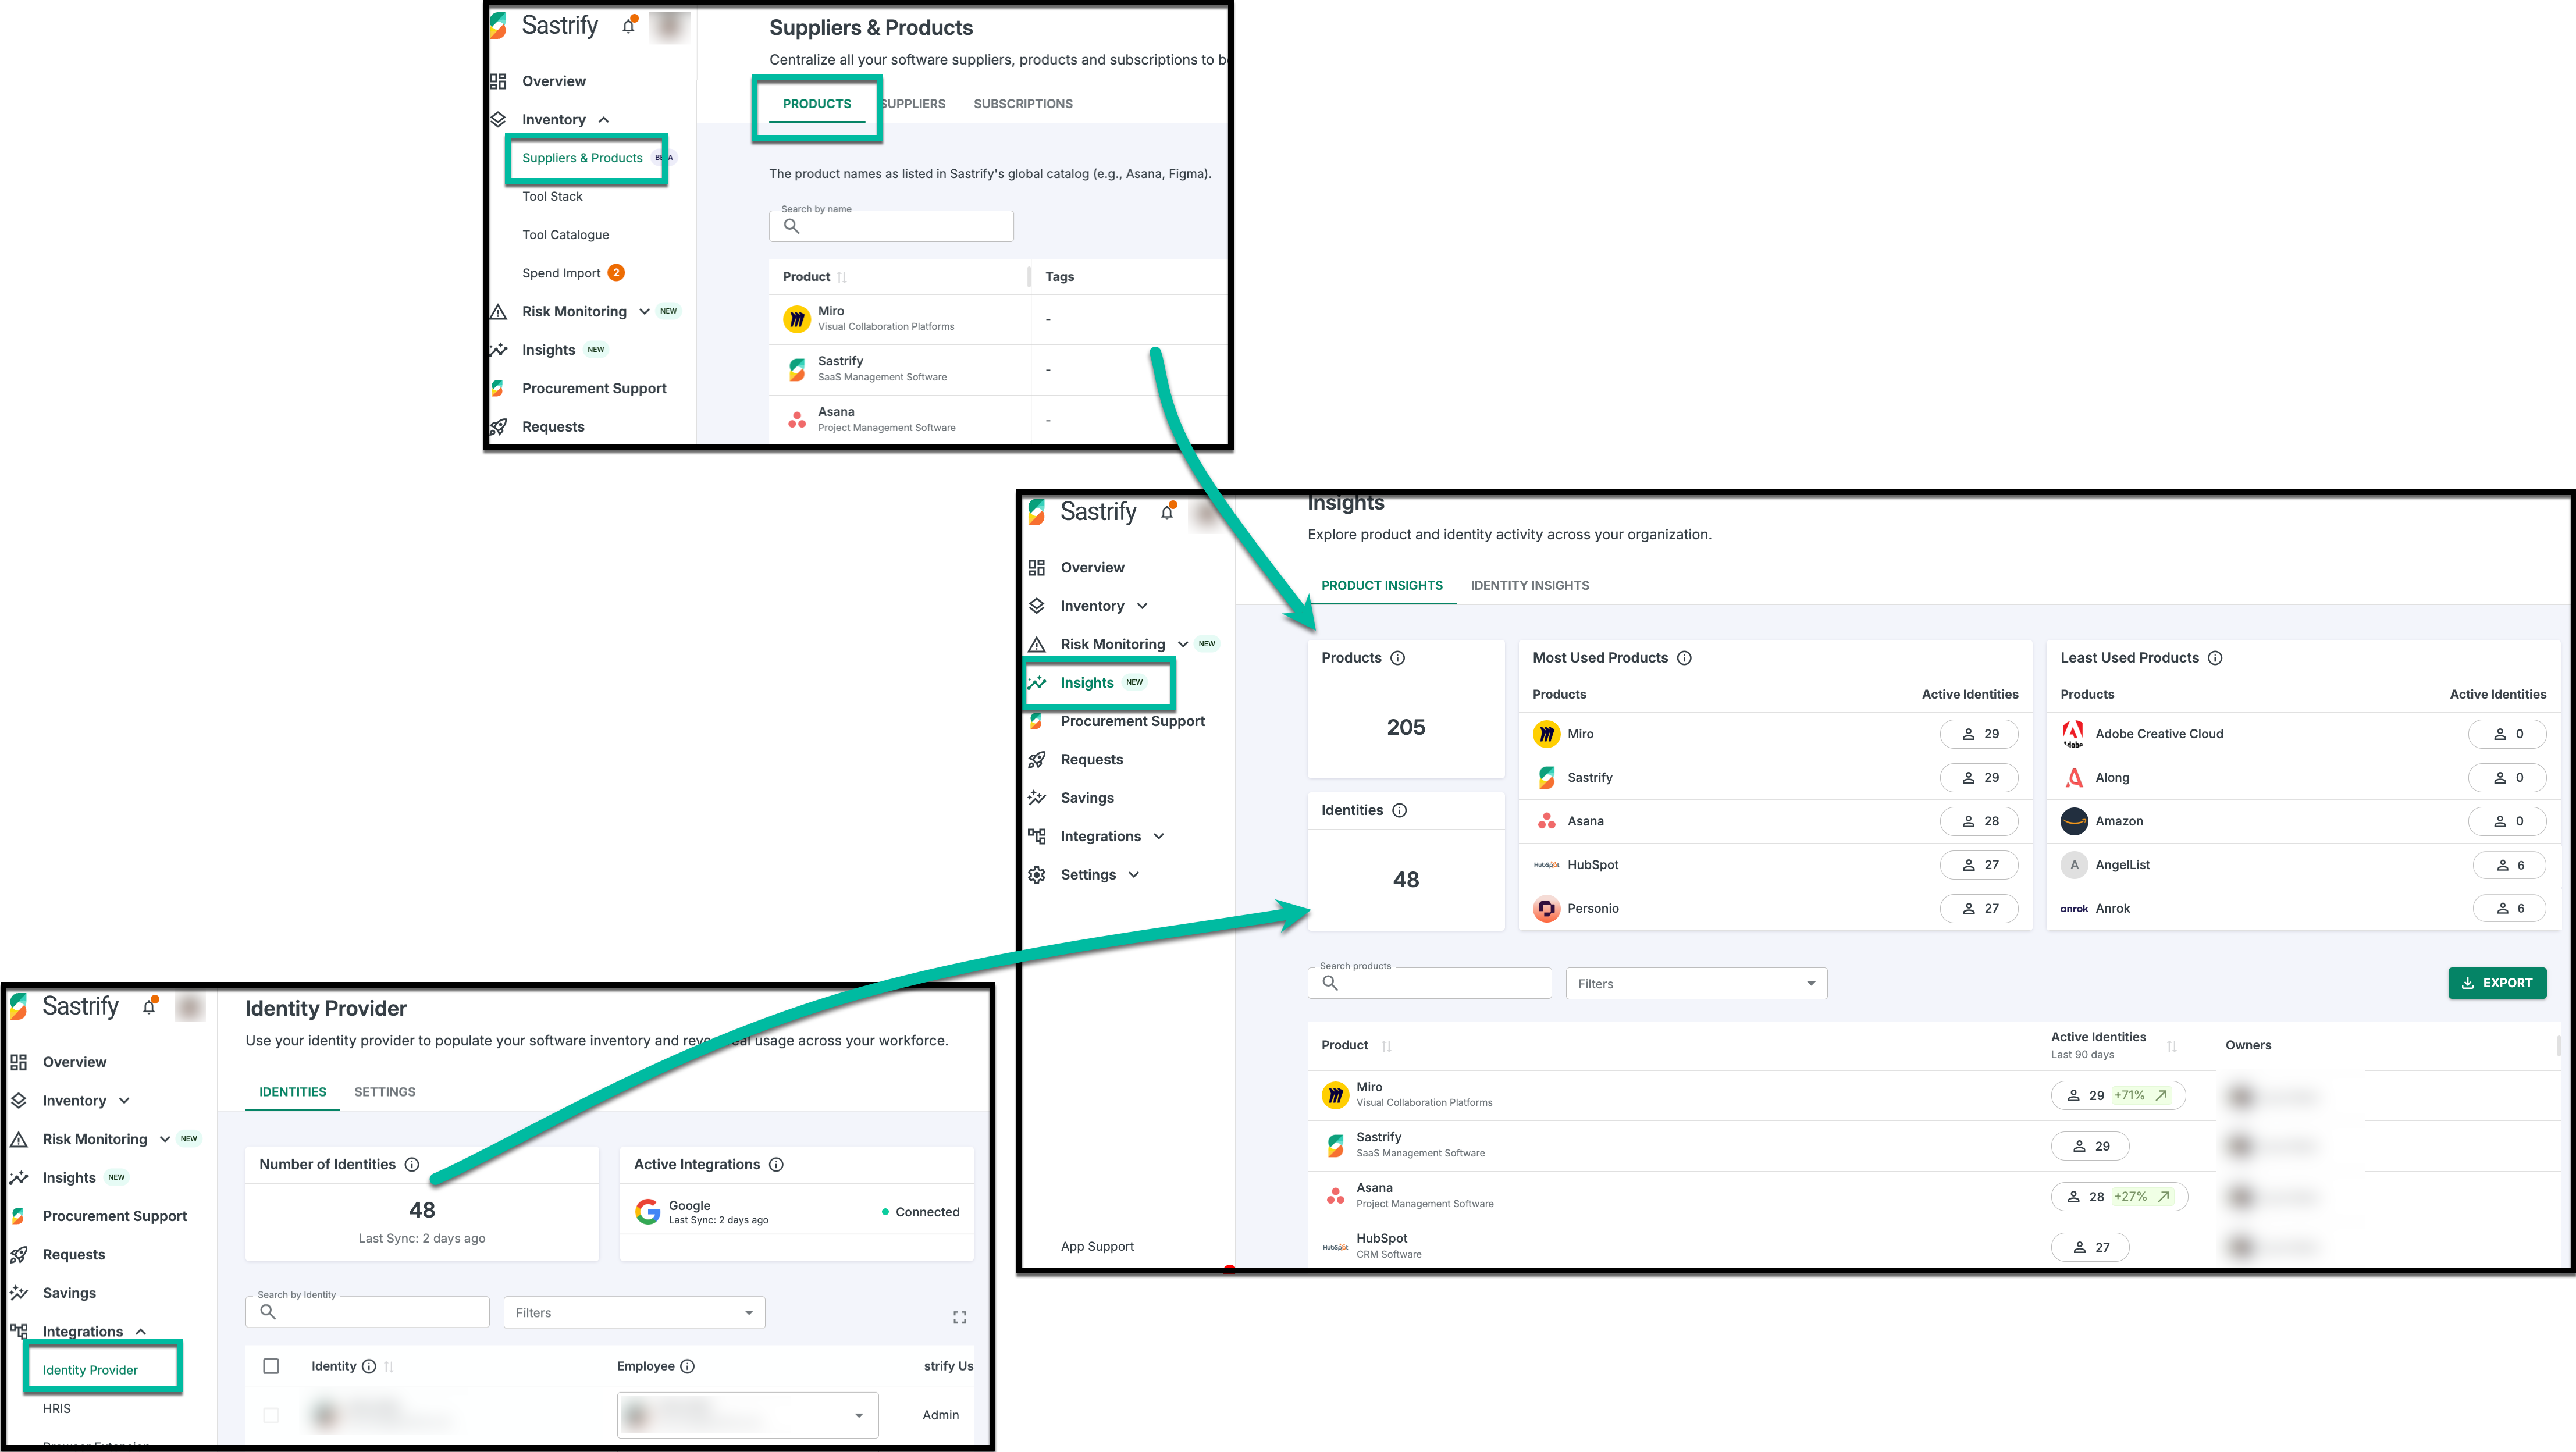
Insights pulls data from two primary pillars to provide a complete picture of your software landscape:
Identity Data: Sourced exclusively from your connected Identity Provider (IdP), such as Okta, Google Workspace, or Microsoft Entra ID.
- Product Data: Derived from your Inventory. This includes assets that originate primarily from your IdP integration and are enriched by the Browser Extension. Once these assets are matched with products and approved, they are sent to your inventory and reflected in your Insights.
Active vs. Inactive Identities
Sastrify categorizes your identities based on their engagement with software over a rolling 90-day window:
Active Identity (IDP): Any user who has a recorded login or demonstrated measurable activity within the last 90 days.
Inactive Identity (IDP): A user recognized by your IDP who has had no login or recorded activity within the last 90 days.
What Defines "Activity"?
Sastrify determines an identity's status by tracking several types of engagement:
SSO Login Events: Successful sign-ins to applications via your company’s IDP.
Browser Extension Events: If deployed, the extension captures active usage on web-based applications.
Interaction Thresholds: For deeper insights, activity is confirmed when a user meets minimum engagement levels:
At least 20 clicks.
At least 15 keystrokes.
Any file upload activity.
A session duration of more than 3 minutes.
Note: Activity metrics track only the frequency of actions and do not capture the content of files or specific keys pressed.
Navigating the Insights Dashboard
The dashboard is split into two primary tabs or views to help you analyze your data:
1. Product Insights: This view focuses on your product inventory and various products are used over the last 90 days.
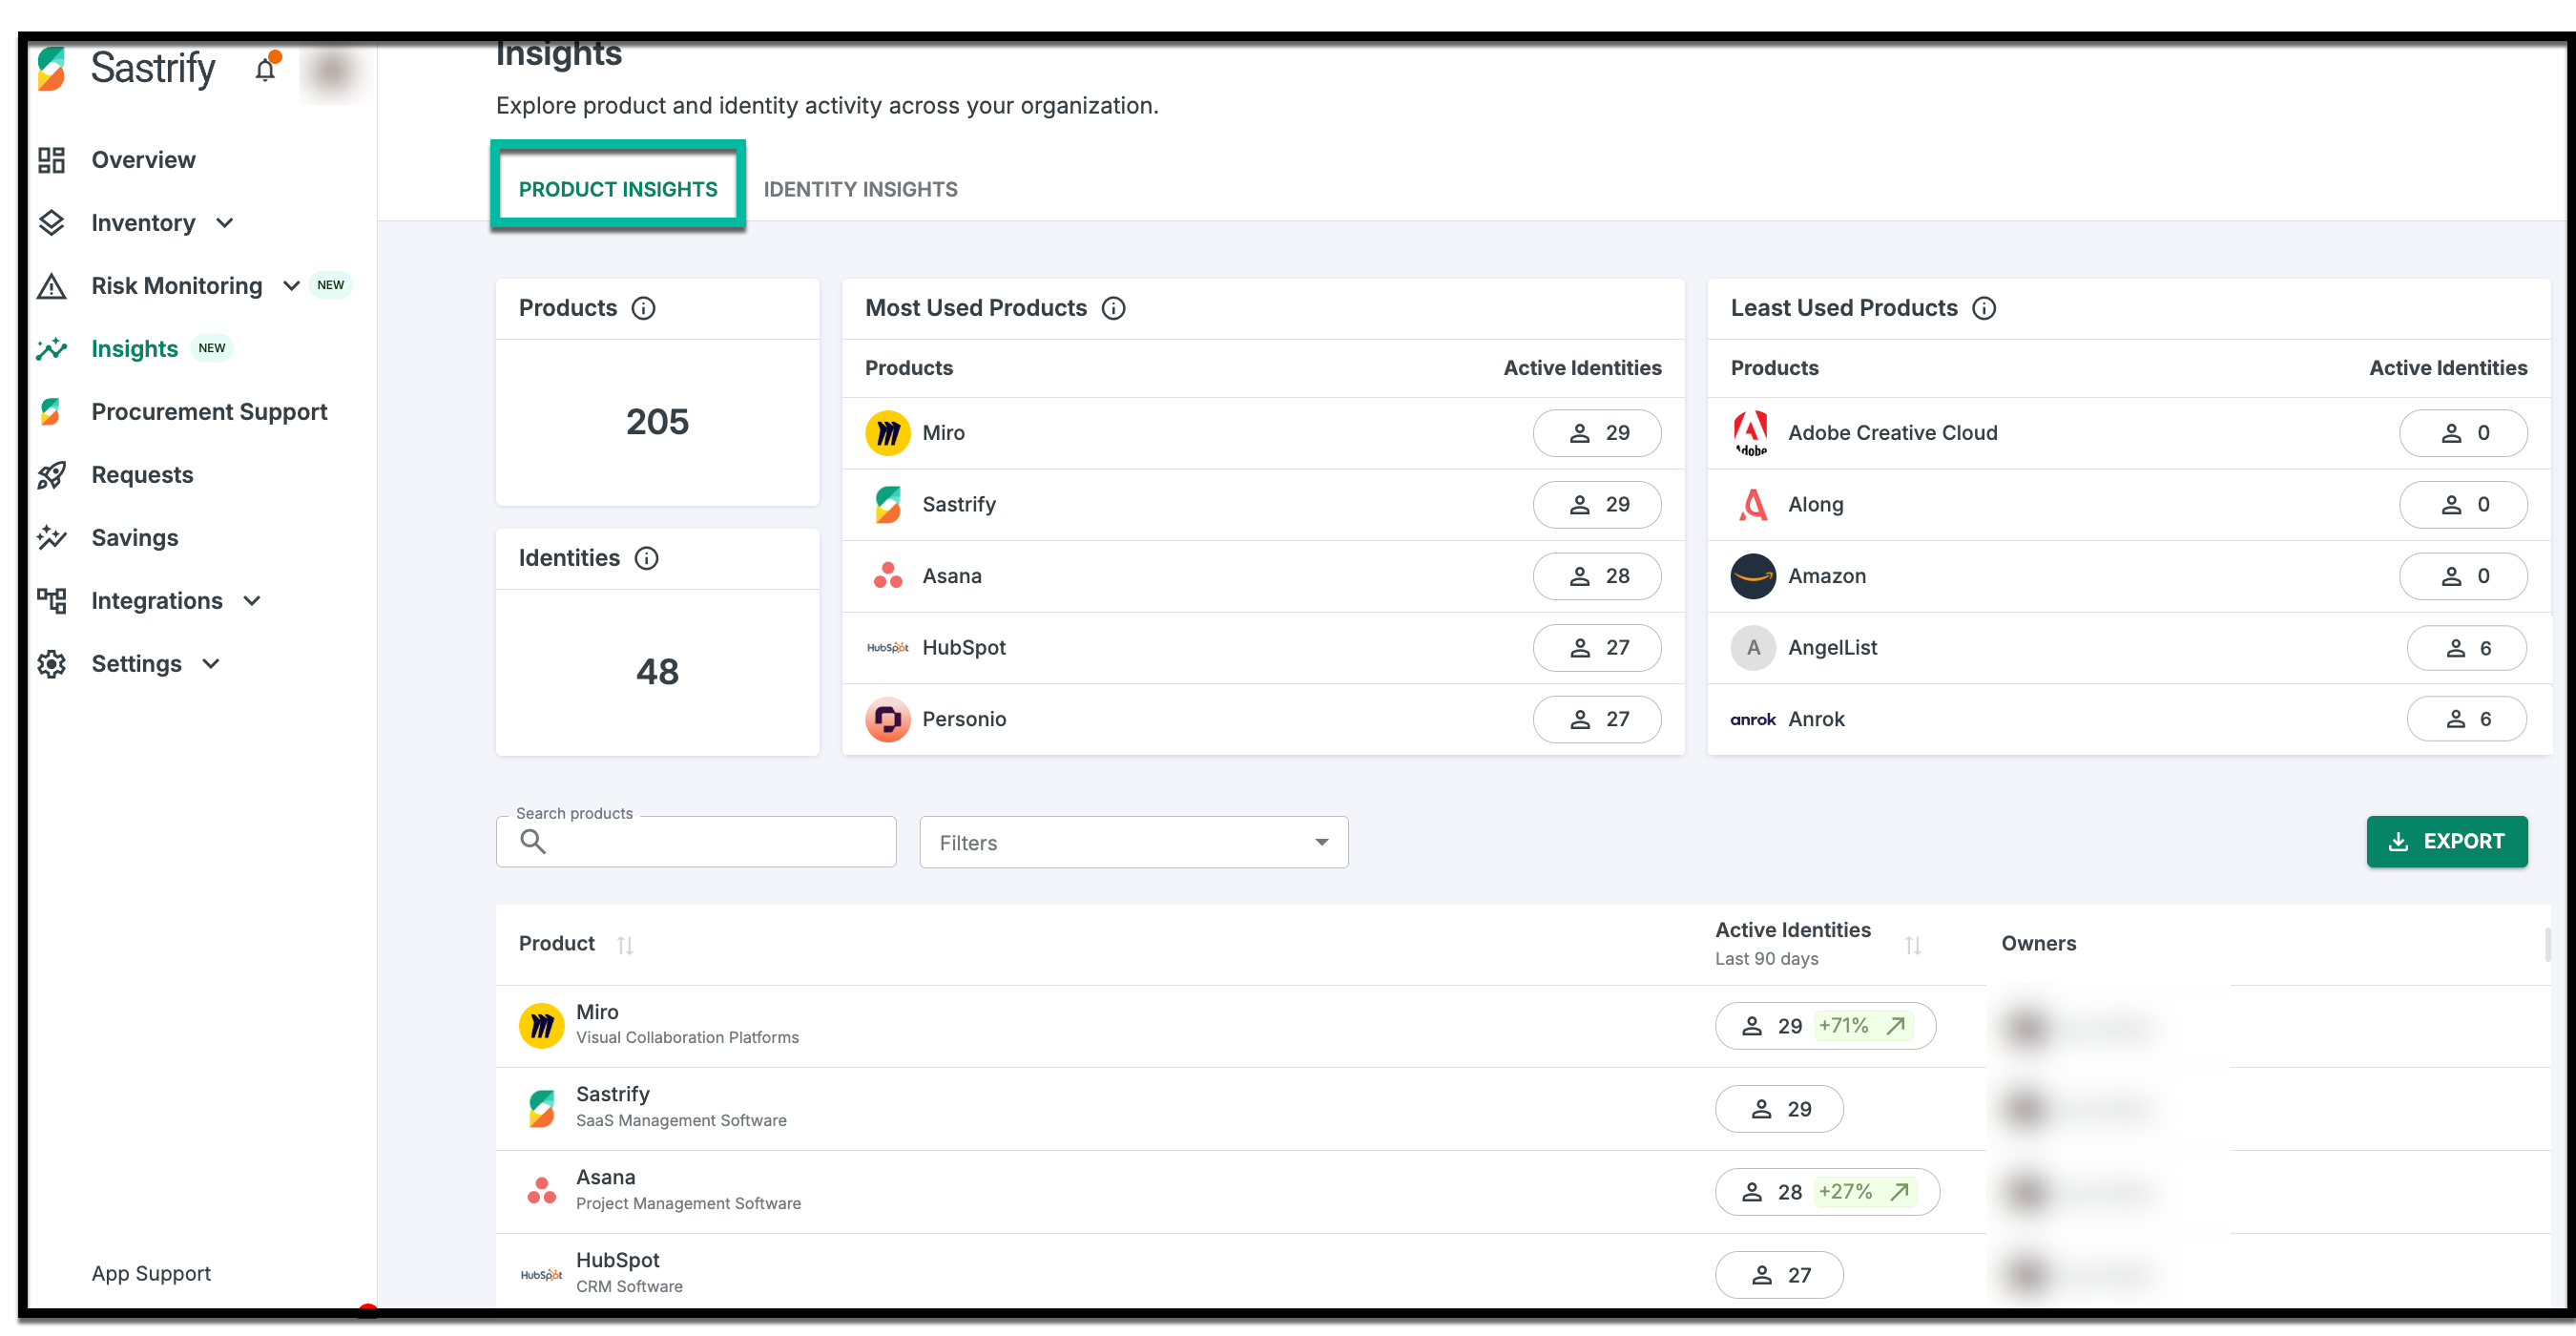
Most Used Products: Highlights tools with the highest adoption rates among active identities.
Least Used Products: Quickly identifies tools with zero usage, signaling potential "shelfware".
Growth Trends: View percentage changes in active identities over the last 90 days to see which tools are gaining or losing momentum.
2. Identity Insights: This view shifts the focus to all registered identities, showing how many are active versus inactive and the status of each identity, as well as the products each one uses.
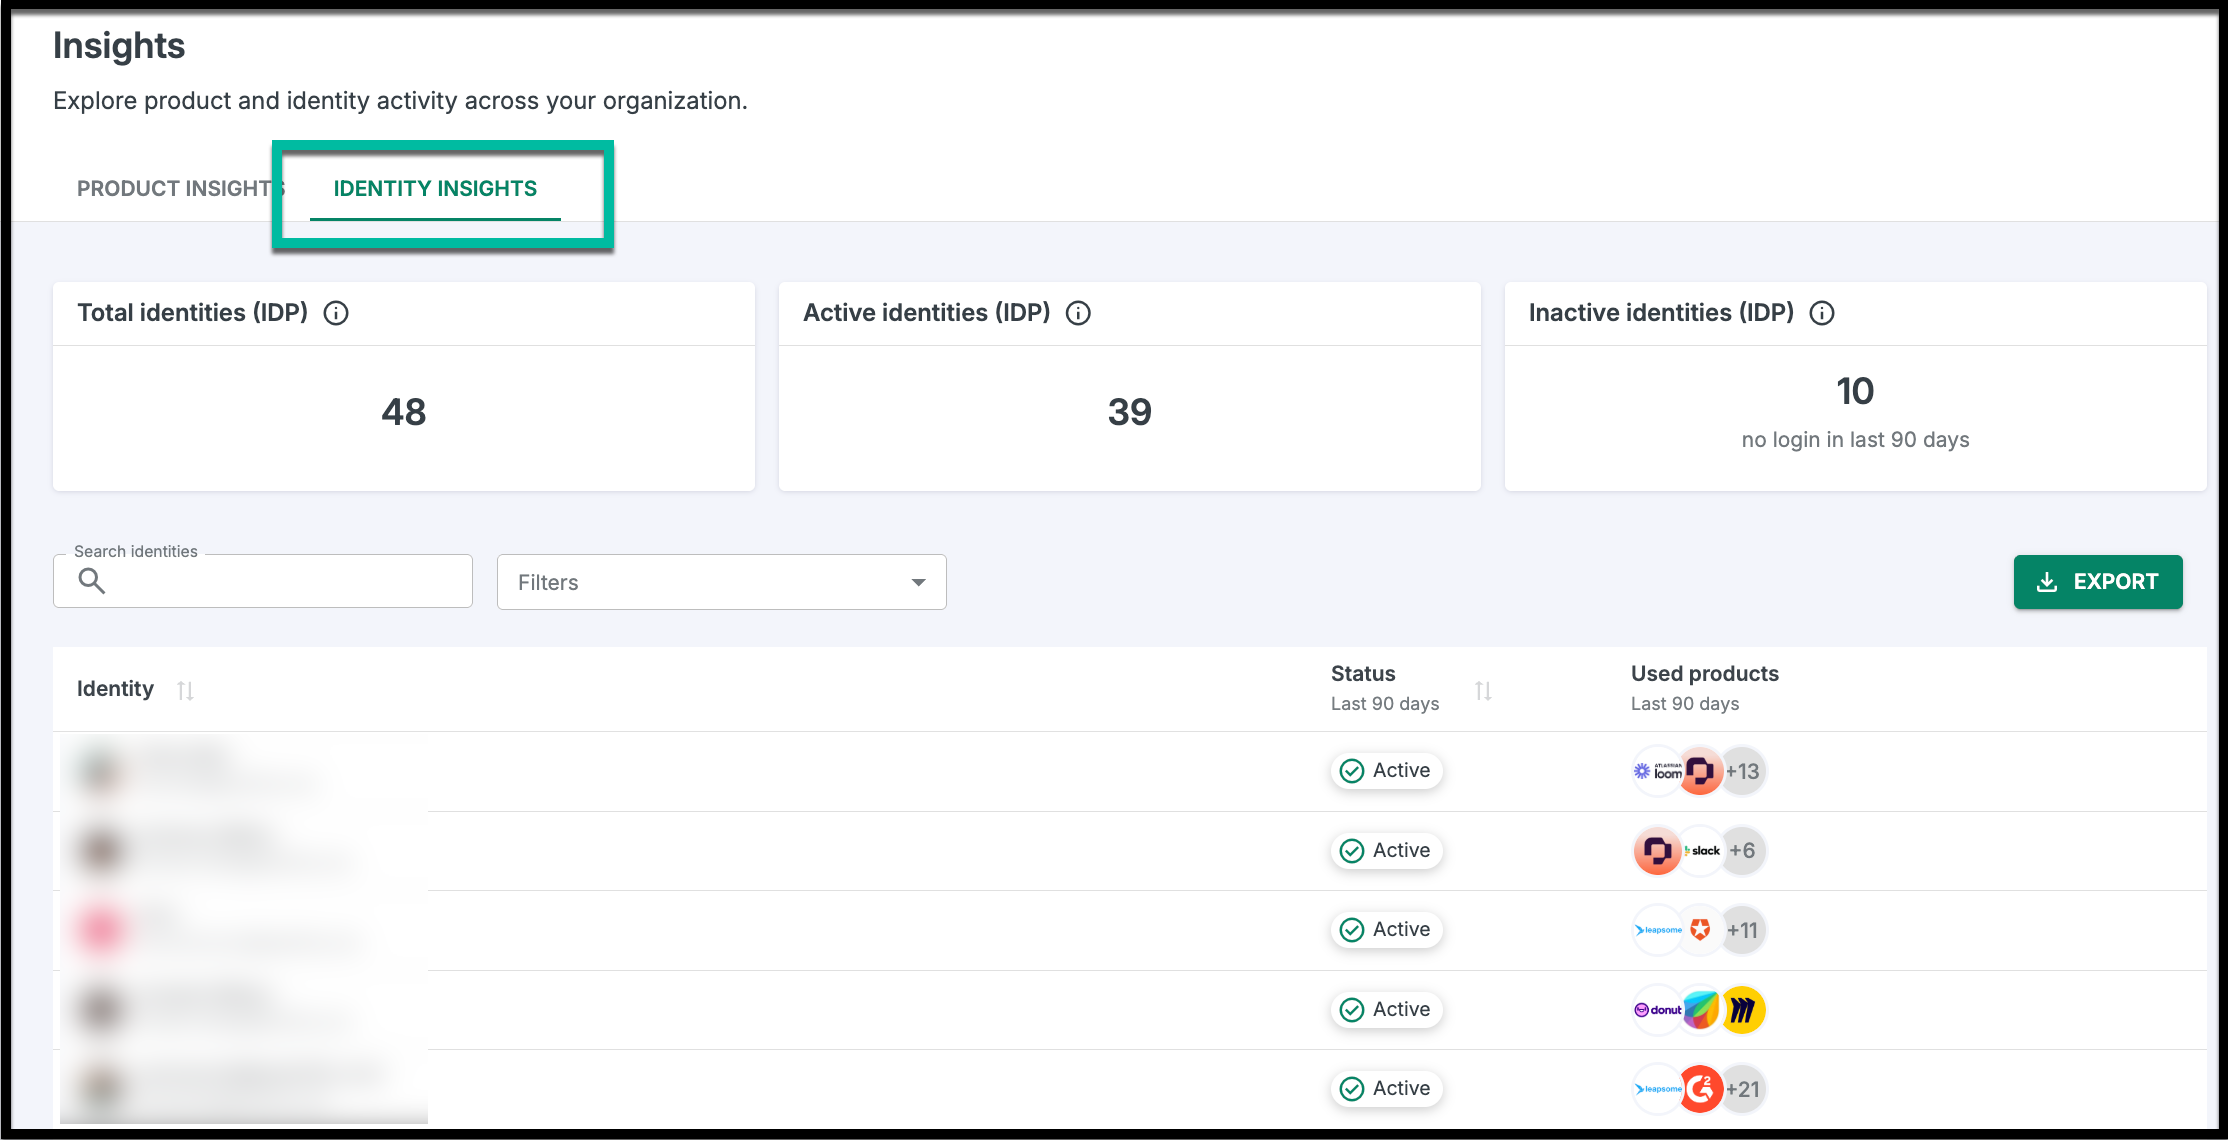
Global Overview: A summary of total, active, and inactive identities across your entire organization.
Individual Usage: See exactly which products (and how many) a specific identity is using.
Frequently Asked Questions
Please refer to the Insights FAQ page for a complete list of frequently asked questions.
Did you find it helpful? Yes No
Send feedback